
Crear libros y hojas de cálculo es a veces solo la mitad del trabajo, puesto que a la hora de hacer reportes en Excel también toca complementarlo con presentaciones en PowerPoint, lo cual implica trasladar tablas y gráficas hasta nuestra presentación.
Por medio de VBA nos es posible automatizar trabajo que de otro modo nos tomaría horas, pero antes de entrar a ello cabe destacar que para poder usar código VBA o fragmentos del mismo junto con PowerPoint debemos meter algo de mano a las opciones de seguridad en PowerPoint para habilitar el uso de macros.
Habilitar Modelo de Objetos de PowerPoint para VBA
Para comenzar, abriremos el editor de VBA (si no recuerdas este paso, puedes consultar en el siguiente enlace), en donde nos iremos a la pestaña «Herramientas» y escogeremos la primera opción que será Referencias:

Se nos abrirán todas las referencias al proyecto VBA. Entre las opciones iremos abajo y vamos a seleccionar «Microsoft PowerPoint 15.0 Object Library»
Se nos abrirán todas las referencias al proyecto VBA. Entre las opciones iremos abajo y vamos a seleccionar «Microsoft PowerPoint 16.0 Object Library».

Daremos OK y con esto ya podremos acceder a PowerPoint desde Excel
Creando la presentación de PowerPoint
Hay dos formas de hacerlo: por medio del «Early Binding» y por medio del «Late Binding». En este caso nos enfocaremos en crear una presentación por medio de la forma con «Early Binding».
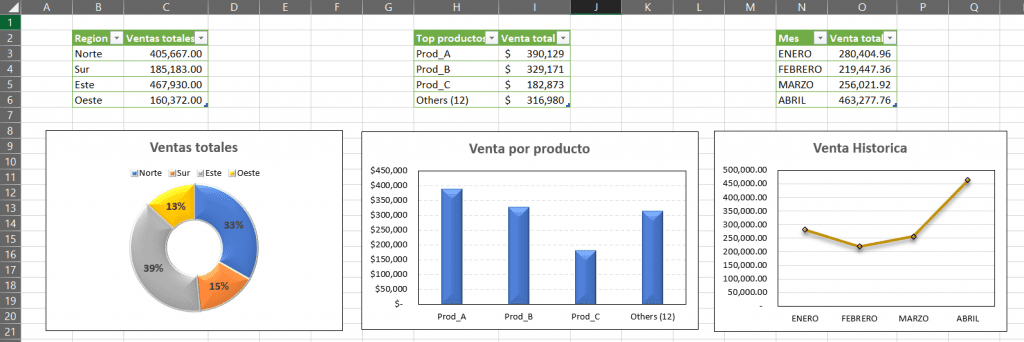
Cuando trabajamos con Excel usualmente preparamos nuestras presentaciones basadas en tablas y la interpretación de las mismas. Para elaborar en esto he creado un pequeño ejemplo:
Lo primero será iniciar el subprocedimiento. Abriremos un nuevo modulo de Excel y, para poder acceder a PowerPoint tendremos que haber habilitado ya el Modelo de Objetos y finalmente será necesario declarar la variable como «PowerPoint.Application».
El código para esto es el siguiente:
Sub PPT_Example()
Dim PPApp As PowerPoint.Application
End Sub
El código para añadir la presentación de Excel a PowerPoint requiere declarar la variable «PowerPoint.Presentation», cuyo código sería este:
Sub PPT_Example()
Dim PPApp As PowerPoint.Application
Dim PPPresentation As PowerPoint.Presentation
End Sub
Luego de añadir la presentación a PowerPoint necesitamos añadir Diapositivas. Para declarar la variable como «PowerPoint.Slide» es necesario este código:
Sub PPT_Example()
Dim PPApp As PowerPoint.Application
Dim PPPresentation As PowerPoint.Presentation
Dim PPSlide As PowerPoint.Slide
End Sub
Una vez el Diapositivas sea añadido al PowerPoint también tendremos que asegurarnos de hacer uso de formas en PowerPoint (como las cajas de texto, por ejemplo). Para declarar esa variable el código es «PowerPoint.Shape»:
Sub PPT_Example()
Dim PPApp As PowerPoint.Application
Dim PPPresentation As PowerPoint.Presentation
Dim PPSlide As PowerPoint.Slide
Dim PPShape As PowerPoint.Shape
End Sub
Si lo que buscamos es acceder a todos los gráficos en nuestra hoja de cálculo hará falta declarar la variable «Excel.ChartObjects» con este código:
Sub PPT_Example()
Dim PPApp As PowerPoint.Application
Dim PPPresentation As PowerPoint.Presentation
Dim PPSlide As PowerPoint.Slide
Dim PPShape As PowerPoint.Shape
Dim PPCharts As Excel.ChartObject
End Sub
Estas variables serán suficientes para comenzar con el proceso, pero también necesitamos iniciar nuestro PowerPoint desde Excel. Dado que es un objeto externo será obligatorio establecer que será un nuevo archivo de PowerPoint. El código para hacer esto es el siguiente:
Sub PPT_Example()
' Seccion de variables
Dim PPApp As PowerPoint.Application
Dim PPPresentation As PowerPoint.Presentation
Dim PPSlide As PowerPoint.Slide
Dim PPShape As PowerPoint.Shape
Dim PPCharts As Excel.ChartObject

'Secccion de lineas para llamar a Power Point
Set PPApp = New PowerPoint.Application
End Sub
Y con esto se abrirá un nuevo archivo en PowerPoint desde Excel. A continuación, nos tocará configurar la variable «PPApp» como igual al PowerPoint que hemos iniciado. Lo que tendremos que hacer es traer el PowerPoint visible y maximizar la ventana con estas líneas de código:
Sub PPT_Example()
' Seccion de variables
Dim PPApp As PowerPoint.Application
Dim PPPresentation As PowerPoint.Presentation
Dim PPSlide As PowerPoint.Slide
Dim PPShape As PowerPoint.Shape
Dim PPCharts As Excel.ChartObject

'Secccion de lineas para llamar a Power Point
Set PPApp = New PowerPoint.Application
PPApp.Visible = msoCTrue
PPApp.WindowState = ppWindowMaximized
End Sub
Con nuestro código listo bastará con presionar F5 o iniciarlo manualmente con la tecla F8 cada vez que queramos avanzar. Si se ha hecho correctamente veremos PowerPoint iniciarse.
Creando la presentacion.
Para continuar, tocaría añadir una presentación a la ventana de PowerPoint que hemos iniciado. Esto lo podemos hacer mediante este código:
Sub PPT_Example()
' Seccion de variables
Dim PPApp As PowerPoint.Application
Dim PPPresentation As PowerPoint.Presentation
Dim PPSlide As PowerPoint.Slide
Dim PPShape As PowerPoint.Shape
Dim PPCharts As Excel.ChartObject

'Secccion de lineas para llamar a Power Point
Set PPApp = New PowerPoint.Application
PPApp.Visible = msoCTrue
PPApp.WindowState = ppWindowMaximized

'Seccion para crear la presentacion
Set PPPresentation = PPApp.Presentations.Add
End Sub
Si todo se ha hecho bien, veremos nuestra presentación en PowerPoint aparecer de esta manera:
Luego de añadir la presentación haría falta agregar un Diapositivas. El código necesario será este:
Sub PPT_Example()
' Seccion de variables
Dim PPApp As PowerPoint.Application
Dim PPPresentation As PowerPoint.Presentation
Dim PPSlide As PowerPoint.Slide
Dim PPShape As PowerPoint.Shape
Dim PPCharts As Excel.ChartObject

'Secccion de lineas para llamar a Power Point
Set PPApp = New PowerPoint.Application
PPApp.Visible = msoCTrue
PPApp.WindowState = ppWindowMaximized

'Seccion para crear la presentacion
Set PPPresentation = PPApp.Presentations.Add

'Seccion para agregar una nueva diapositiva
Set PPSlide = PPPresentation.Slides.Add(1, ppLayoutTitleOnly)
End Sub
Si quieres aprender mas de como funciona esta linea, lo puedes ver aqui.
Pegar las graficas
Ya tenemos nuestra presentacion lista para empezar a llenarla. Para pasar una grafica a la diapositiva debemos primero depositarla dentro de la variable.
Set PPCharts = ActiveSheet.ChartObjects(1)
Ahora, usando los metodos de copiar y pegar, seleccionaremos la variable y la pasaremos a Power Point de la siguiente forma:
Sub PPT_Example()
' Seccion de variables
Dim PPApp As PowerPoint.Application
Dim PPPresentation As PowerPoint.Presentation
Dim PPSlide As PowerPoint.Slide
Dim PPShape As PowerPoint.Shape
Dim PPCharts As Excel.ChartObject
'Secccion de lineas para llamar a Power Point
Set PPApp = New PowerPoint.Application
PPApp.Visible = msoCTrue
PPApp.WindowState = ppWindowMaximized
'Seccion para crear la presentacion
Set PPPresentation = PPApp.Presentations.Add
'Seccion para agregar una nueva diapositiva
Set PPSlide = PPPresentation.Slides.Add(1, ppLayoutTitleOnly)
'Pegar una grafica.
Set PPCharts = ActiveSheet.ChartObjects(1)
PPCharts.Copy
PPSlide.Shapes.PasteSpecial(ppPasteEnhancedMetafile, msoCTrue).Select
End Sub
Pero aun falta, ya que tenemos más de un gráfico en la hoja de cálculo. Siendo así, tendremos que establecer un bucle a través de cada gráfica y pegarla en la presentación. Aquí abajo se encuentra el código que debemos copiar y pegar:
Sub PPT_Example()

' Seccion de variables
Dim PPApp As PowerPoint.Application
Dim PPPresentation As PowerPoint.Presentation
Dim PPSlide As PowerPoint.Slide
Dim PPShape As PowerPoint.Shape
Dim PPCharts As Excel.ChartObject

'Secccion de lineas para llamar a Power Point
Set PPApp = New PowerPoint.Application
PPApp.Visible = msoCTrue
PPApp.WindowState = ppWindowMaximized

'Seccion para crear la presentacion
Set PPPresentation = PPApp.Presentations.Add

'Bucle para crear las diapositivas y pegar las graficas
For Each PPCharts In ActiveSheet.ChartObjects
Set PPSlide = PPApp.ActivePresentation.Slides.Add(PPApp.ActivePresentation.Slides.Count + 1, ppLayoutText)

'Pegar la grafica actual
PPCharts.Copy
PPSlide.Shapes.PasteSpecial DataType:=ppPasteMetafilePicture

'Opcional, por si quieres ajustar el tamano y posicion de la grafica
PPSlide.Shapes(PPSlide.Shapes.Count).Left = 300
PPSlide.Shapes(PPSlide.Shapes.Count).Top = 100
PPSlide.Shapes(PPSlide.Shapes.Count).Width = 300
PPSlide.Shapes(PPSlide.Shapes.Count).Height = 300

Next PPCharts

End Sub
¡Y es así como en cuestión de minutos podemos ahorrar horas de trabajo!
Hay muchos elementos en la diapositiva que se pueden programar, por no decir casi todos, por lo que te invito a seguir investigando y cualquier duda nos leemos abajo.
